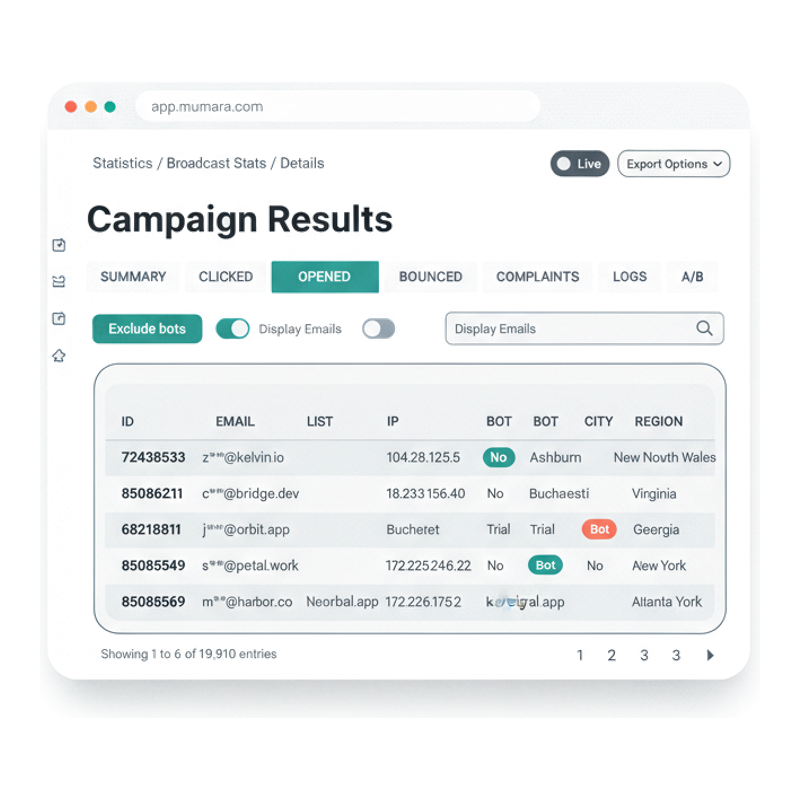
Exclude bots
Apple Mail Privacy Protection, mailbox security scanners, link-checkers — they all generate fake opens and clicks. Toggle Exclude bots ON and Mumara filters them out for accurate engagement rates. Without it, your open rate is fiction.
Insights · per-recipient detail
From the account-wide Dashboard to the per-recipient drill-down across the full tab set — Summary, Opened, Clicked, Unsubscribed, Bounced, Complaints, Logs, A/B. With bot exclusion, Live mode, and Export Options on every campaign.
Layered reporting
Reporting in Mumara works in layers. Each layer answers a different question; together they cover everything from "how are we doing this week" to "which IP did Anna click from."
Account-wide
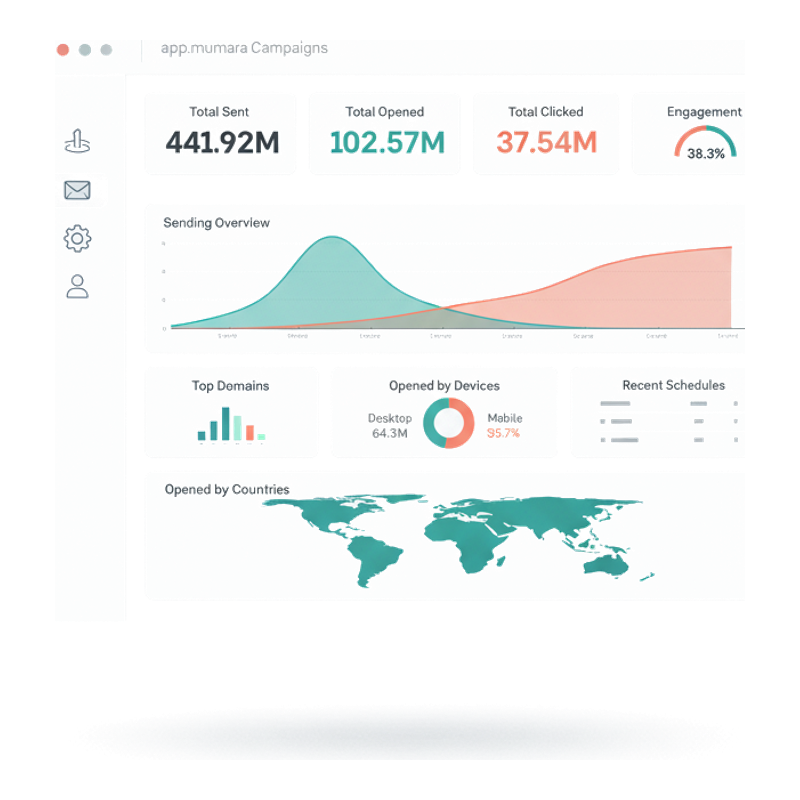
A single screen with everything that matters: total sent / opened / clicked counters, live-sending chart, top domains, opens by device, opens by country (geo heatmap), recent schedules, recent activities. The screen your team checks before lunch.
All broadcasts
A table of every campaign you have run — sorted, filtered, searched. Per row: capacity, sent, dropped, opened, clicked, unsubscribed. Click into any campaign for the per-recipient drill-down.
Per-recipient detail
A full tab set covering every angle — Summary, Opened, Clicked, Unsubscribed, Bounced, Complaints, Logs, A/B. Per-recipient rows with IP, city, region, device, and bot flag. The depth most ESPs hide; Mumara surfaces.
The Dashboard
The Dashboard is the front door — total sent, opened, clicked across the lifetime of your account, with a live-sending chart, top domain breakdown, device-mix donut, and a geo heatmap of opens by country. Plus recent schedules and a live activity feed. Built for the morning standup, not the spreadsheet team.
Total Sent / Opened / Clicked across all campaigns ever, alongside the Live Sending chart that updates as you send. One glance answers "are we on track."
Bar chart of mailbox-provider distribution, donut chart of Desktop / Mobile mix. Shape your sending strategy around the audience you actually have.
Opens by Countries — a shaded world map with hover detail. Spot a campaign that landed strongly in EMEA, or one that completely missed APAC.
Real-time stream of what's happening — opens, clicks, unsubs — as events arrive. The operational complement to the analytical charts.
Per-campaign drill-down
Click into any broadcast and Mumara renders a tabbed view that covers the entire performance surface. No "summary screen with a vague chart" — every event is reachable, per-recipient.
High-level metrics — sent, delivered, open rate, click rate, bounce rate.
Every recipient who opened, with IP, city, device, and bot status.
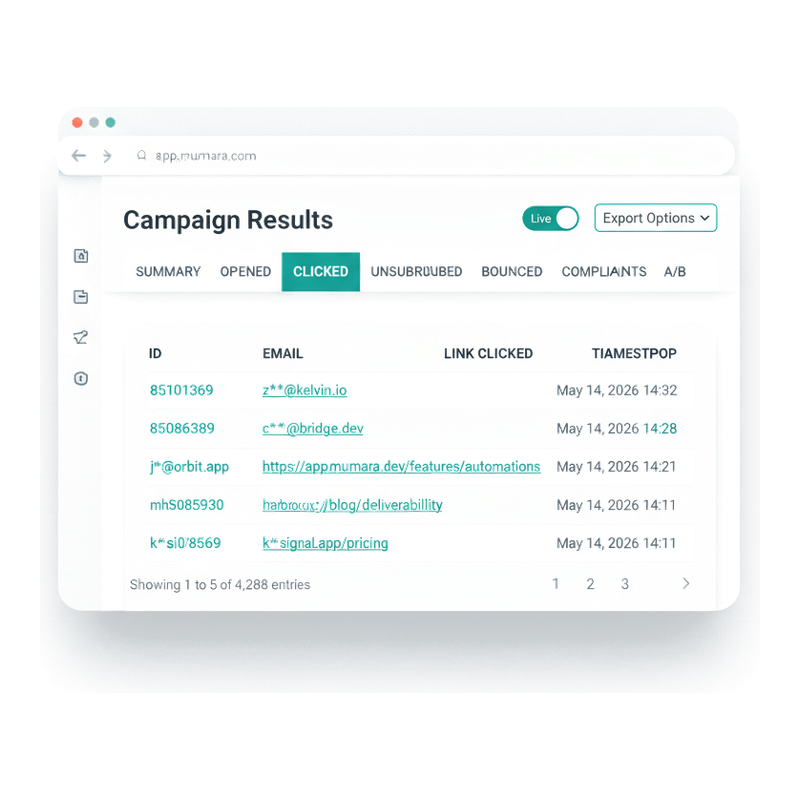
Every click event with the exact link clicked, recipient, and timestamp.
Per-recipient unsubscribe events with timestamp and source.
Every bounce with type (Soft/Hard), rule ID, reason, and details.
FBL complaints by recipient with details and timestamp.
Full delivery log for the campaign — every action Mumara took on every recipient.
Variant performance side-by-side when the campaign was a split test.
Per-recipient click drill-down
The CLICKED tab lists every individual click event for a campaign — recipient, the exact URL clicked, and the timestamp. Spot the link that converted, the recipient who clicked seven different things, the timezone where engagement peaked. Per-event granularity, not per-day aggregates.
A row per click — same recipient appears multiple times if they clicked multiple times. The activity-level view that aggregates can never reveal.
The full clicked URL is in the table. See exactly which CTA, which footer link, which embedded link drove engagement. Position-test data without setting up A/B variants.
Per-click timestamps let you build send-time-vs-engagement-time analysis without needing the raw event log. When you do need raw, Export Options has you covered.
OPENED has IP, city, region, bot flag per row. BOUNCED has type, code, reason. COMPLAINTS has details and timestamp. Every tab is a window into per-recipient data.
The three controls that matter
Mumara surfaces three controls on every Campaign Results view. Each fixes a real reporting problem most ESPs leave broken.
Apple Mail Privacy Protection, mailbox security scanners, link-checkers — they all generate fake opens and clicks. Toggle Exclude bots ON and Mumara filters them out for accurate engagement rates. Without it, your open rate is fiction.
A small toggle in the top-right that streams events in real time. Useful when you've just sent and want to watch the queue drain, or when investigating an active deliverability issue. Off for batch analysis; on for operations.
Pull data out at any time — per-tab CSV, full event log, scheduled exports. Mumara never holds your data hostage. Plug into your warehouse, share with stakeholders, archive for compliance.
What shallow reporting costs
When you can only see aggregates, every interesting question is unanswerable. The depth gap between Mumara's reporting and competitor ESPs is the depth gap between 'we sent a thing' and 'we know what happened.'
In 2026, image-cached opens from Apple Mail Privacy Protection alone can inflate open rates by 30-50%. Without an Exclude bots toggle, every campaign report lies to you about engagement — and you optimise toward the wrong metric.
Your competitor ESP says '8.7% click rate.' That's a number, not an insight. Mumara says '4,288 clicks across 12 unique links, with one recipient clicking 7 times and three IPs clicking from a single corporate gateway.' The second view answers real questions.
If your dashboard updates once a day, you can't react to a deliverability incident while it's happening. Mumara's Live mode streams events as they arrive — operations and analytics in one surface, not two.
ESPs that lock you out of raw event data force you to build reporting twice — once in their tool, once when you eventually want it in your warehouse. Mumara's Export Options means the data is yours from day one.
“The per-recipient drill-down is the feature we didn't know we needed until we had it. The Logs tab in particular has saved us hours on every deliverability investigation — every Mumara action on every recipient, in one timeline.”
Verified review
Mumara customer
Common questions
Mumara classifies each open event as bot-driven or human based on signals like image-prefetch patterns, user agent, IP origin (datacenter vs residential), and click-through behaviour. The Bot Exclusion toggle on every Campaign Results view filters bot events out of the displayed metrics — so your open rate reflects actual human engagement, not Apple Mail Privacy Protection or scanner pre-fetches. Bot status is also visible per-row in the OPENED tab as a BOT column for transparency.
The Live toggle on Campaign Results turns on real-time event streaming. New opens, clicks, and other events appear in the table as they arrive — no manual refresh. Useful for watching a freshly-sent campaign drain through the queue or for investigating an active deliverability issue. Off by default; toggle on when you want to watch in real time.
Yes. Export Options on every Campaign Results view supports per-tab exports (CSV of opens, clicks, bounces, etc.) and raw event logs. For larger account-wide exports, the API surfaces the same data programmatically. Mumara never holds your reporting hostage — your data goes where you want it.
Different views of the same events. The BOUNCED tab inside any broadcast's Campaign Results shows bounces specifically for that broadcast — the bounce events, classifications, and reasons that came back from this send. The Suppression Management view shows the cumulative list of suppressed contacts across all sends. Use BOUNCED to diagnose a specific campaign; use Suppression Management to manage the consequences.
Per-recipient event log for the campaign — every action Mumara took on every recipient: queued, sent, delivered, bounced, opened, clicked, unsubscribed, complained. The full timeline per contact. Indispensable for deliverability investigations ('did this person actually receive the email?') and compliance ('show me every send to this contact').
Inside the campaign's Results view, the A/B tab. Each variant's send count, open rate, click rate, and chosen-winner status. Plus the rollout audience (the rest of the list after the winner was picked). Pairs with the dedicated A/B Testing feature — see /campaigns/features/ab-testing/.
Engagement-event retention varies by plan tier — typically 3 days on the entry plan, 7 days on Pro, 30 days on Business. The retention affects stats-based segments (which look back at engagement) and the Logs tab depth. For senders who need longer retention, the Mumara Machine plans include extended retention by default. See the pricing page for current per-tier specifics.
Yes. The Campaigns Statistics view lists every campaign with its sent / opened / clicked / unsubscribed counters in one table, sortable and filterable. Filter by admin, search by campaign name, sort by any metric. Click into any row for the per-campaign drill-down.
Related
Every broadcast generates a Campaign Results view with the 8-tab drill-down. Reporting is the natural follow-through of sending.
Read moreSplit tests get their own A/B tab in the per-campaign drill-down — variant-by-variant performance side by side.
Read moreThe BOUNCED and COMPLAINTS tabs in Campaign Results are powered by the bounce-processing pipeline.
Read morePer-server throughput and queue depth flow into the Dashboard — see the infrastructure layer behind every metric.
Read morePush every reporting event (open, click, bounce, complaint) to your own systems in real time. Addon.
Read moreMirror Mumara events into Google Analytics for unified web + email funnels. Addon.
Read moreMumara Campaigns · Reporting & Analytics
Reporting & Analytics ships with every Mumara Campaigns plan — Self-Hosted and Mumara Machine. The Dashboard, Campaigns Statistics, and per-campaign 8-tab drill-down are all included. Free trial includes the full reporting surface — try it on a real campaign before you commit.